
Project Portfolio Gallery
Categories:
Dashboards (Power BI, Tableau, Excel)
SQL Case Studies
Data Cleaning & Transformation (Power Query)
Business Scenarios (KPI/Financial modeling)

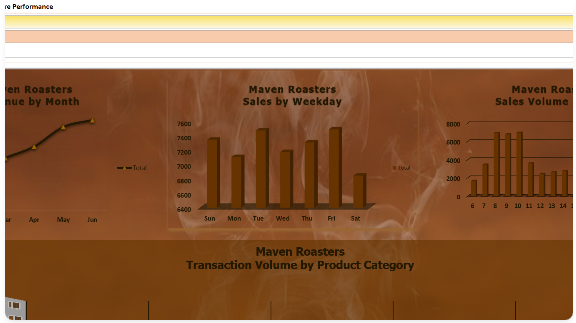
About this project: Financial Overview Dashboard – Maven Roasters
Tool: Excel | Focus: Revenue, Expenses, Profitability
📈 Built in Excel for executive-level financial reporting, this dashboard provides a clear snapshot of monthly revenue, operating costs, and profit margins. Features include slicers for region and category, dynamic variance indicators, and a summary of budget vs actuals.
➡️ Impact: Helped leadership quickly assess cash flow, track budget adherence, and spot areas of financial leakage or margin opportunity.
About this project: Sales KPI Dashboard – Regional Performance Tracker
Tool: Power BI | Focus: Regional Sales KPIs & Executive Insights
📊 A dynamic dashboard built to help leadership monitor sales performance across four U.S. regions. It includes KPIs such as YoY growth, revenue by region, top-performing product categories, and monthly performance trends.
➡️ Impact: Enabled senior stakeholders to quickly assess revenue gaps, identify growth opportunities, and optimize inventory decisions.
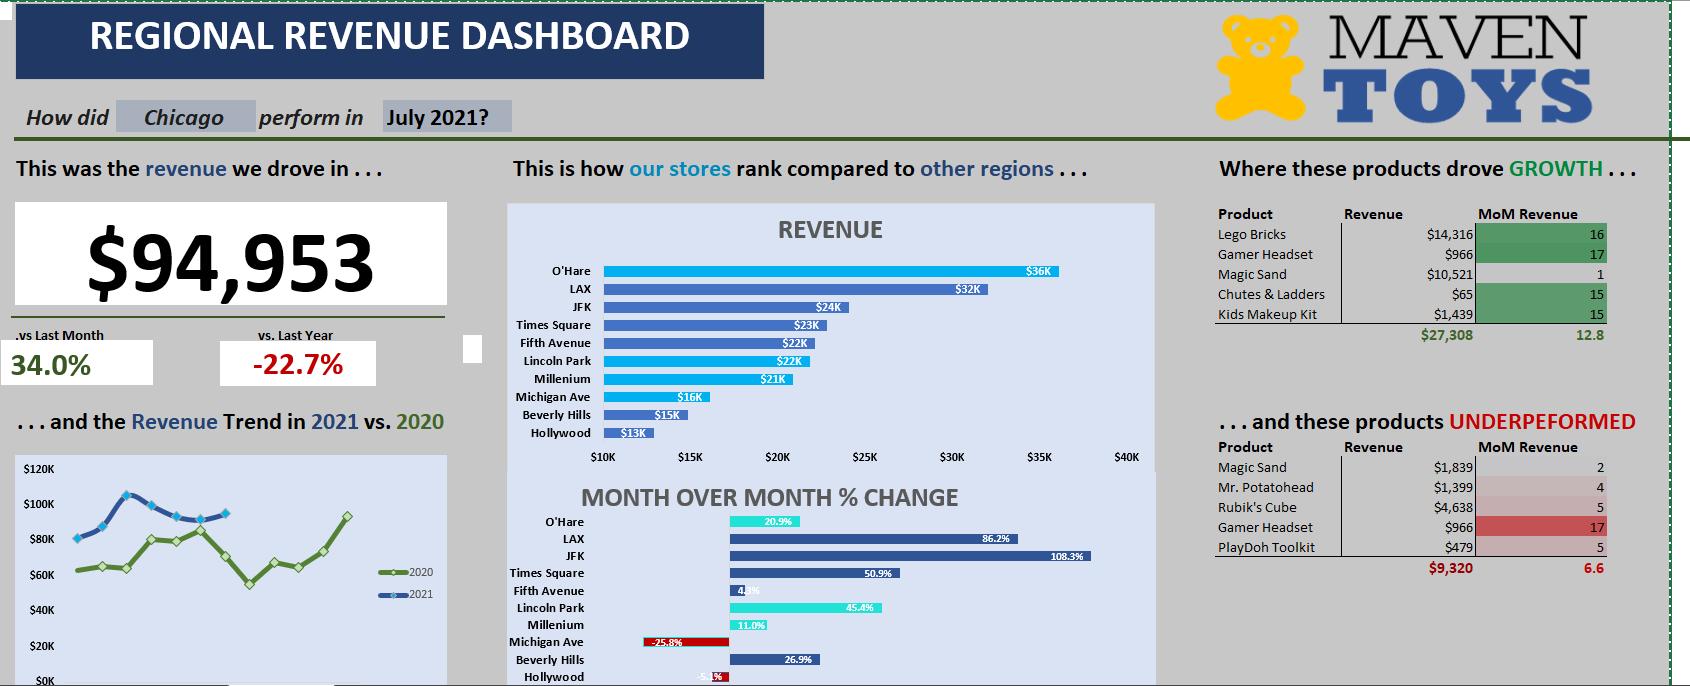
About this project:
Revenue Performance Dashboard – Maven Toys
Tool: Power BI | Focus: Revenue Trends, Product Segments, Interactive Filtering
🧸 An interactive dashboard built to analyze revenue by product category, region, and channel. Features include dynamic filters, sparkline trend visuals, and breakdowns by customer type — enabling quick identification of top-selling items and underperforming SKUs.
➡️ Impact: Helped business leaders assess market trends and adapt product strategy to drive revenue growth across key regions.